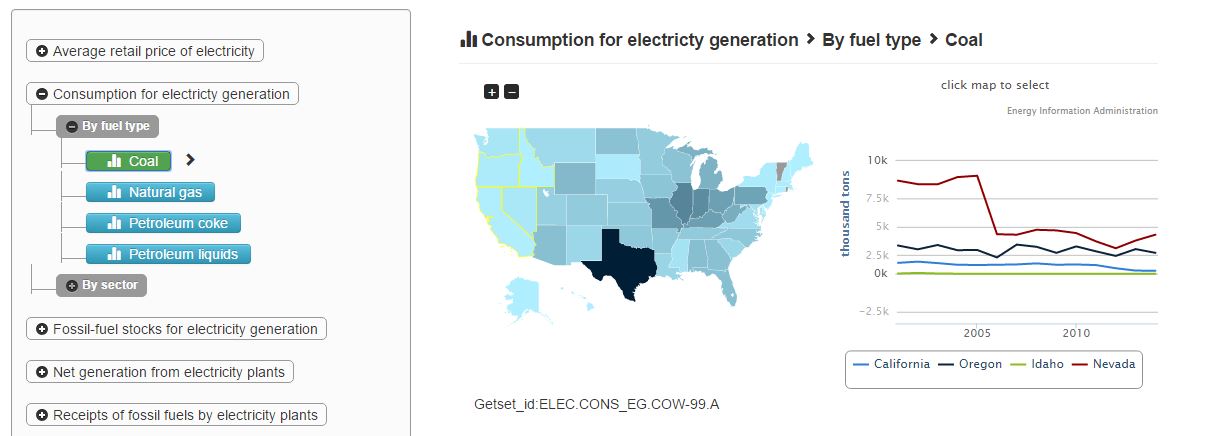
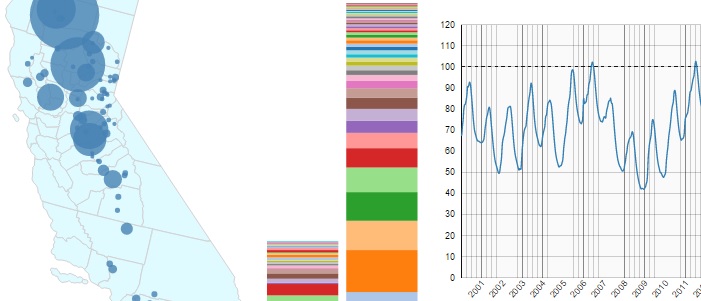
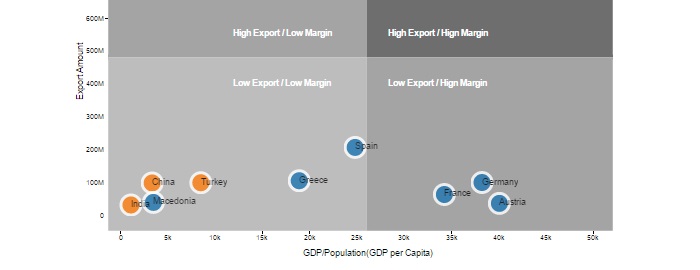
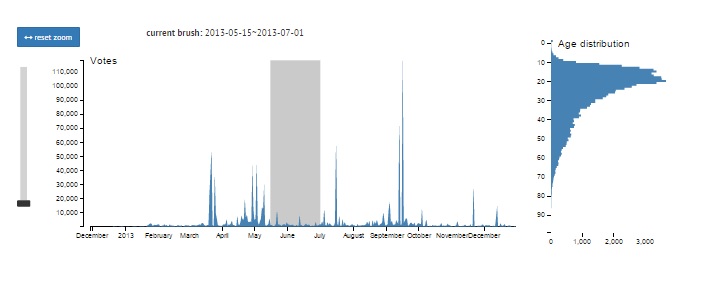
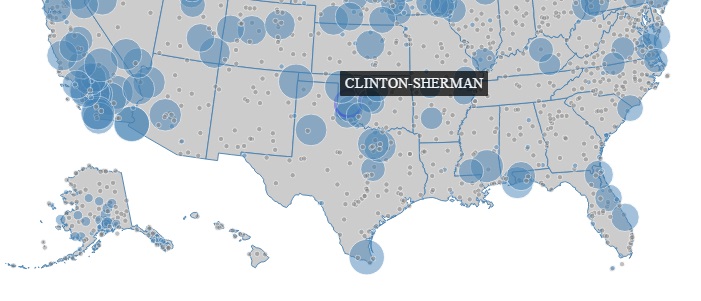
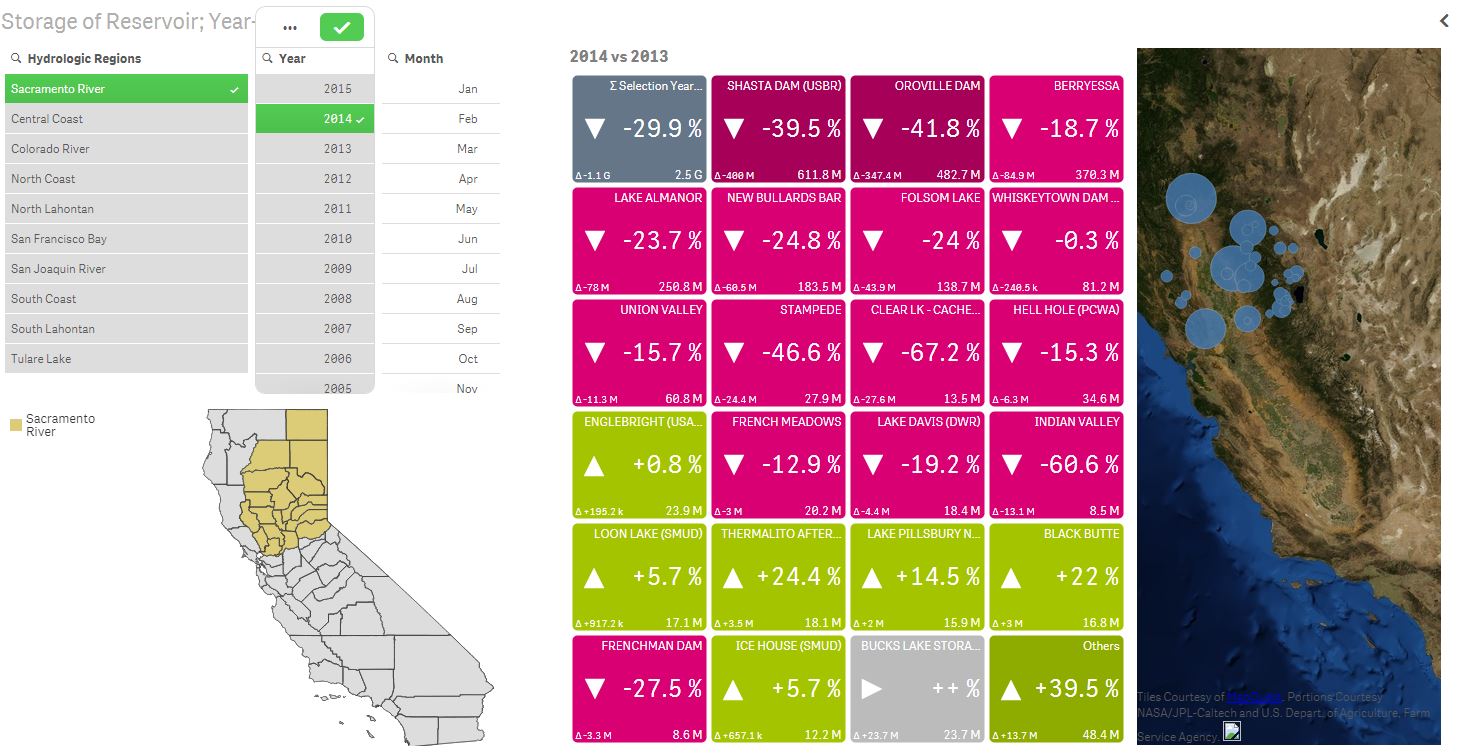
Python, Django App

EIA Data Explorer

Shows multiple maps and charts, sourced from the U.S. Energy information Administration (EIA). It enables users to compare between different categories and find interesting details.

View Project

Data Visualizations with d3.js

California Drought

Reservoir levels over time in California and water usage comparisons.

View Project

World Trade Cargo & Logistics Planning

Visualizing the characteristics of the top 10 export partners by country.

View Project

My World 2015 Data

The results of questionnaire called My World 2015 by United Nations.

View Project

Solar Radiation Data

US Solar insolation map.

View Project

Qlik View & Qlik Sense

Download application files.

View Project